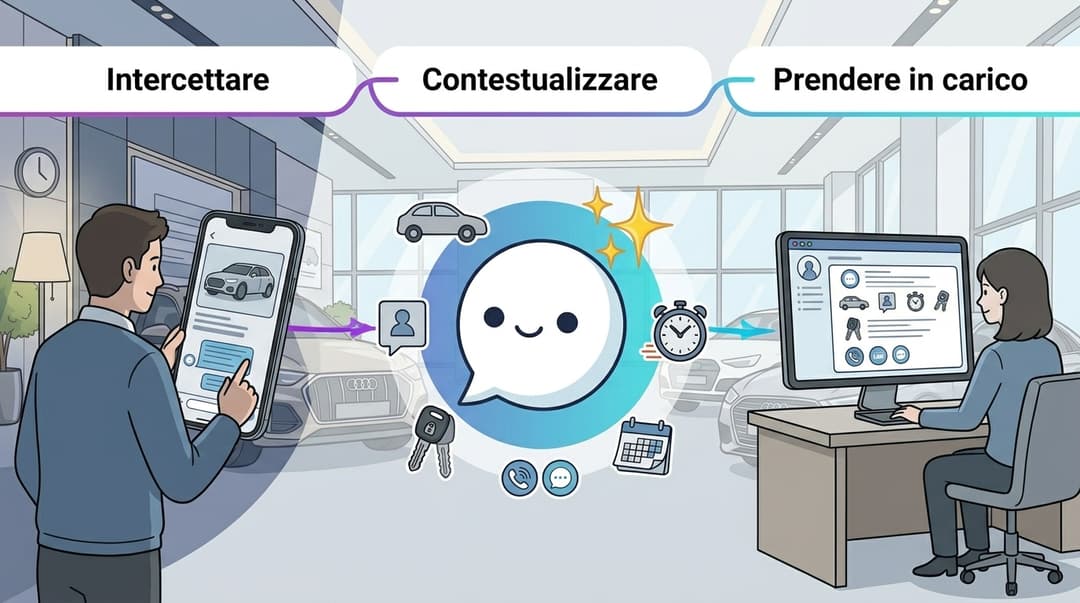
Car dealership marketing: the Monday report, without spreadsheets
The story of Sarah, a dealership marketing manager who used to export spreadsheets from five tools every Monday. What the job involves, which KPIs belong on the dashboard, and how to build the Monday report in 30 minutes.
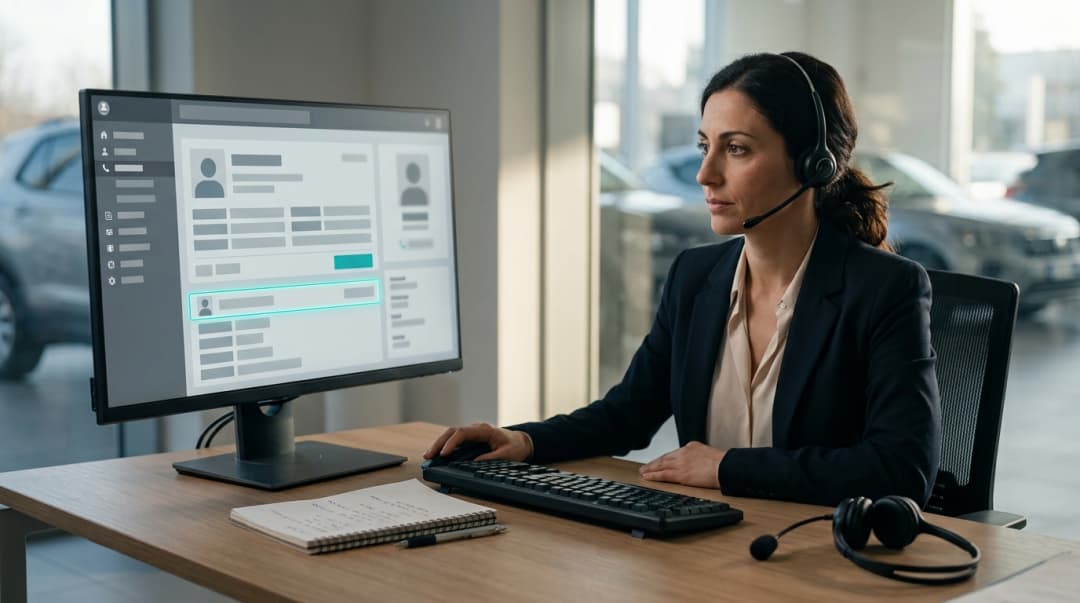
Monday, 8:15 am. It used to be five exports and a spreadsheet. Now it is three plain-English questions and a dashboard the dealer principal opens on their phone.
Monday, 8:15 am. Sarah, the marketing manager at a two-rooftop dealership, has a coffee and a 9:30 meeting with the dealer principal. Until a few months ago, those 75 minutes went on exporting data from five tools and pasting it into a spreadsheet. This is the story of how her Monday changed, and a practical guide for anyone doing her job: what car dealership marketing actually involves, which KPIs matter, and how to build the Monday report in half an hour.
Car dealership marketing: what the job really is
Car dealership marketing means bringing in useful leads for sales and service, and proving where they come from and what they become. The marketing manager plans campaigns and budgets, runs the website, portals, social and the brand's digital programme, and reports a few clear numbers every week: leads by source, appointments, opportunities won and lost. The Monday report is where all of that turns into decisions.
Before: five exports and a spreadsheet
Sarah's old Monday went like this. Export leads from the CRM. Export contacts from the listing portals. Pull the website report from Google Analytics. Count WhatsApp chats by asking the salespeople. Download appointments from the calendar tool. Then an hour of copy, paste, filters and pivot tables.
At 9:30 the dealer principal always asked the same question: “And how many of these actually came in?” The answer needed another export. And the numbers were already a week old.
What a dealership marketing manager does
The role varies from group to group, but the recurring work looks like this.
- Plan campaigns and budgets with management and the brand's plans: model launches, used cars, service, events.
- Run the digital channels: website, listing portals, social, paid search and social ads, WhatsApp.
- Measure sources: how many leads each channel brings, and how many become appointments and deals.
- Work with sales and service so every lead has an owner and a next step.
- Manage the brand's digital programme, with its tracking and reporting requirements.
- Report weekly and monthly to the dealer principal, with a view on what to keep and what to cut.
The sales manager looks at the same numbers from the other side: the team, targets, deals. That's why in many dealerships there is one Monday report, and it serves both.
Monday, 8:15 am, today: three questions instead of exports
Today Sarah opens MIA and writes to the internal AI assistant in plain English, the way she'd message a colleague:
"Leads by source over the last 4 weeks, website chat versus forms."
The assistant writes a read-only query, limited to her company's data, and shows a bar chart right in the conversation. The data is live MIA data: CRM, conversations, website tracking. Sarah hasn't exported anything.
Second question: “Conversations handled by the AI versus staff, by week.” Third: “Opportunities won and lost in the last month, by source.” Three charts in a few minutes. She adds them to a dashboard called “Monday”, with a date-range filter. That's what an AI dashboard means in practice: you ask, it draws, you keep what's useful.
It works in the mobile app too. On Tuesday, between two meetings, Sarah asks for a chart on her phone and sees it there.
The dealership KPI dashboard: which metrics and why
A useful dashboard isn't the one with the most charts. It's the one that answers Monday's questions. These are the metrics we recommend.
- Leads by source: website (chat and forms), WhatsApp, phone, portals, Lead Ads. It tells you where to invest.
- Time to first useful response: how long a customer waits for real information, not a “we'll call you”. Measure it wherever your tools record it.
- Appointments set and shown: a lead that never becomes an appointment is just a contact.
- Opportunities won and lost, with the reason: price, trade-in, timing, no reply. The reason is worth more than the number.
- Conversations handled by AI and by staff: to understand team workload and uncovered hours.
- Cost per source, if you have it: calculated with spend from the ad platforms, outside MIA. MIA provides the lead side, not the spend.
For the lead handling behind these numbers, see lead management for dealerships.
Where the leads really come from
The hardest Monday question is always “where did this customer come from?”. MIA's website tracking is first-party: visitors, sessions, landing pages, referrers, UTM, forms submitted, chats opened and chat conversions, with navigation funnels. When a visitor leaves their details, the session is linked to the customer in the CRM.

The same goes for WhatsApp: MIA records website-to-WhatsApp attribution and Click-to-WhatsApp ad referrals. Facebook and Instagram Lead Ads are imported automatically every few minutes. And when MIA pushes a lead to an external CRM, it can carry UTM, gclid, channel, source page, the chat summary and a transcript link. For a broader view on leads, read automotive leads for dealerships.
GA4 and the brand's digital programme
The brand wants to see conversations in the website's GA4, using the standard ASC events. MIA pushes the chat events to the dataLayer (asc_comm_engagement and asc_comm_submission, with the sales or service department). Sarah doesn't have to chase the web agency. We cover the details in ASC tracking for automotive campaigns.
The dashboard the dealer principal opens on their phone
At 9:30 the meeting is different. Sarah has shared the “Monday” dashboard with the team and created a public link for the dealer principal, who opens it on their phone. The charts refresh on their own, so the same link works next Monday too. Two widgets also sit on the MIA homepage.
Then Sarah sets an alert rule: if website chats on a given day drop below a threshold, she and the sales manager get a browser push notification, with a cooldown between alerts and only during the active hours she set. If the website form breaks on a Wednesday, she won't find out the following Monday.
Wednesday: the flow report decides the next campaign
Mid-week Sarah checks the report for the open-quote follow-up flow: WhatsApp templates sent, delivered, read, button clicks and replies; and for AI calls, calls answered and not answered. The message with the “Book a test drive” button gets more clicks than the other one. The next campaign starts from there. Campaigns and flows are built in WhatsApp campaigns for dealerships.
How to build the Monday report in 30 minutes
- Minutes 0–5: open the Monday dashboard filtered on the week that just closed.
- Minutes 5–10: leads by source. What went up, what went down, is any source at zero that shouldn't be?
- Minutes 10–15: opportunities created, won and lost, by source and by channel.
- Minutes 15–20: opportunities won and lost, with the reason. Read three lost conversations, not just the number.
- Minutes 20–25: flow and campaign reports. What to keep, what to stop.
- Minutes 25–30: write three lines of decisions. One thing to do, one to stop, one to check. Send the link to the dealer principal.
If a new question comes up in the meeting, ask the assistant there and then. No need to park it until next week.
What MIA doesn't do, to be clear
- It doesn't send scheduled email or PDF reports: the dashboard is opened online or shared via a link.
- Alerts are browser push notifications, not email or WhatsApp.
- It doesn't read ad spend: cost per source is calculated outside MIA.
- Charts are requested from the internal assistant; a new report builder is in development and not yet available.
For the full platform, start from MIA; for connected CRMs, see integrations.
FAQ
Questions about dealership marketing, KPIs and reporting
The questions marketing managers and sales managers ask most when they prepare the weekly dealership report.
Want to see your Monday report built this way?
In a demo we ask the internal assistant for your charts: leads by source, AI and staff conversations, opportunities by source. Then we put them on a shared dashboard.
Related solutions